ϳԹ

Video loading...
While the nationwide shutdowns in the spring and winter decreased the overall number of cyclist deaths, the picture we were left with was still as tragic and dire as ever.
#2020cyclingdeaths

What We Learned from Tracking Cycling Deaths for a Year


Published:  Updated: 

With the help of the nonprofit BikeMaps.org, we analyzed the data we collected on bicyclists killed by drivers in 2020 and found some surprising takeaways


New perk: Easily find new routes and hidden gems, upcoming running events, and more near you. Your weekly Local Running Newsletter has everything you need to lace up! .

In December, the driver of a box truck plowed into a group of cyclistsriding along U.S. Highway 95 south of Las Vegas. Five people died in the crash, and it was later discoveredthat the driver hadmethamphetamine in his system. At ϳԹ, we were horrified by the tragedy,which was covered in and news, but we also knew it was part of a troubling trend: record numbers ofcyclists (andthousandsofpedestrians)on our nation’sroads are being killed by drivers often without any media attention beyond a brieflocal news story. In 2018, in crashes with drivers, the deadliest year for people on bikes since 1990. In 2019, while the total number of deaths , cities like New York recorded their highest number of cyclist fatalities ever.

Last January, in response to those disturbing numbers,we launched the#2020CyclingDeaths project, which aimed to track every person on a bike killed by a driver in the U.S. over the course of the year.In the end, we recorded 697 cyclist deaths.Since we were only able to count deaths reported by local media, the actual total is likely significantlyhigher.The five victims of the Nevada crash were numbers662through 666in our database.

In late December, we partnered with the nonprofit , founded by Trisalyn Nelson, a professor in geographic information science at the University of California atSanta Barbara. BikeMaps.org has been collecting crowdsourced information about cyclist crashes, near misses, traffic hazards (like potholes and road construction), and bike thefts in the U.S. and Canada since 2014. Itsteam helped us analyze the data we collected and synthesize the information. While the overall number of cyclists deaths in 2020 appears to be lower than the past couple of years, likely because of the spring lockdowns in response to the pandemic, there is no sign that our streets are getting safer. Here’s what we found.

Number of Cyclists Killed by Driversin 2020: 697

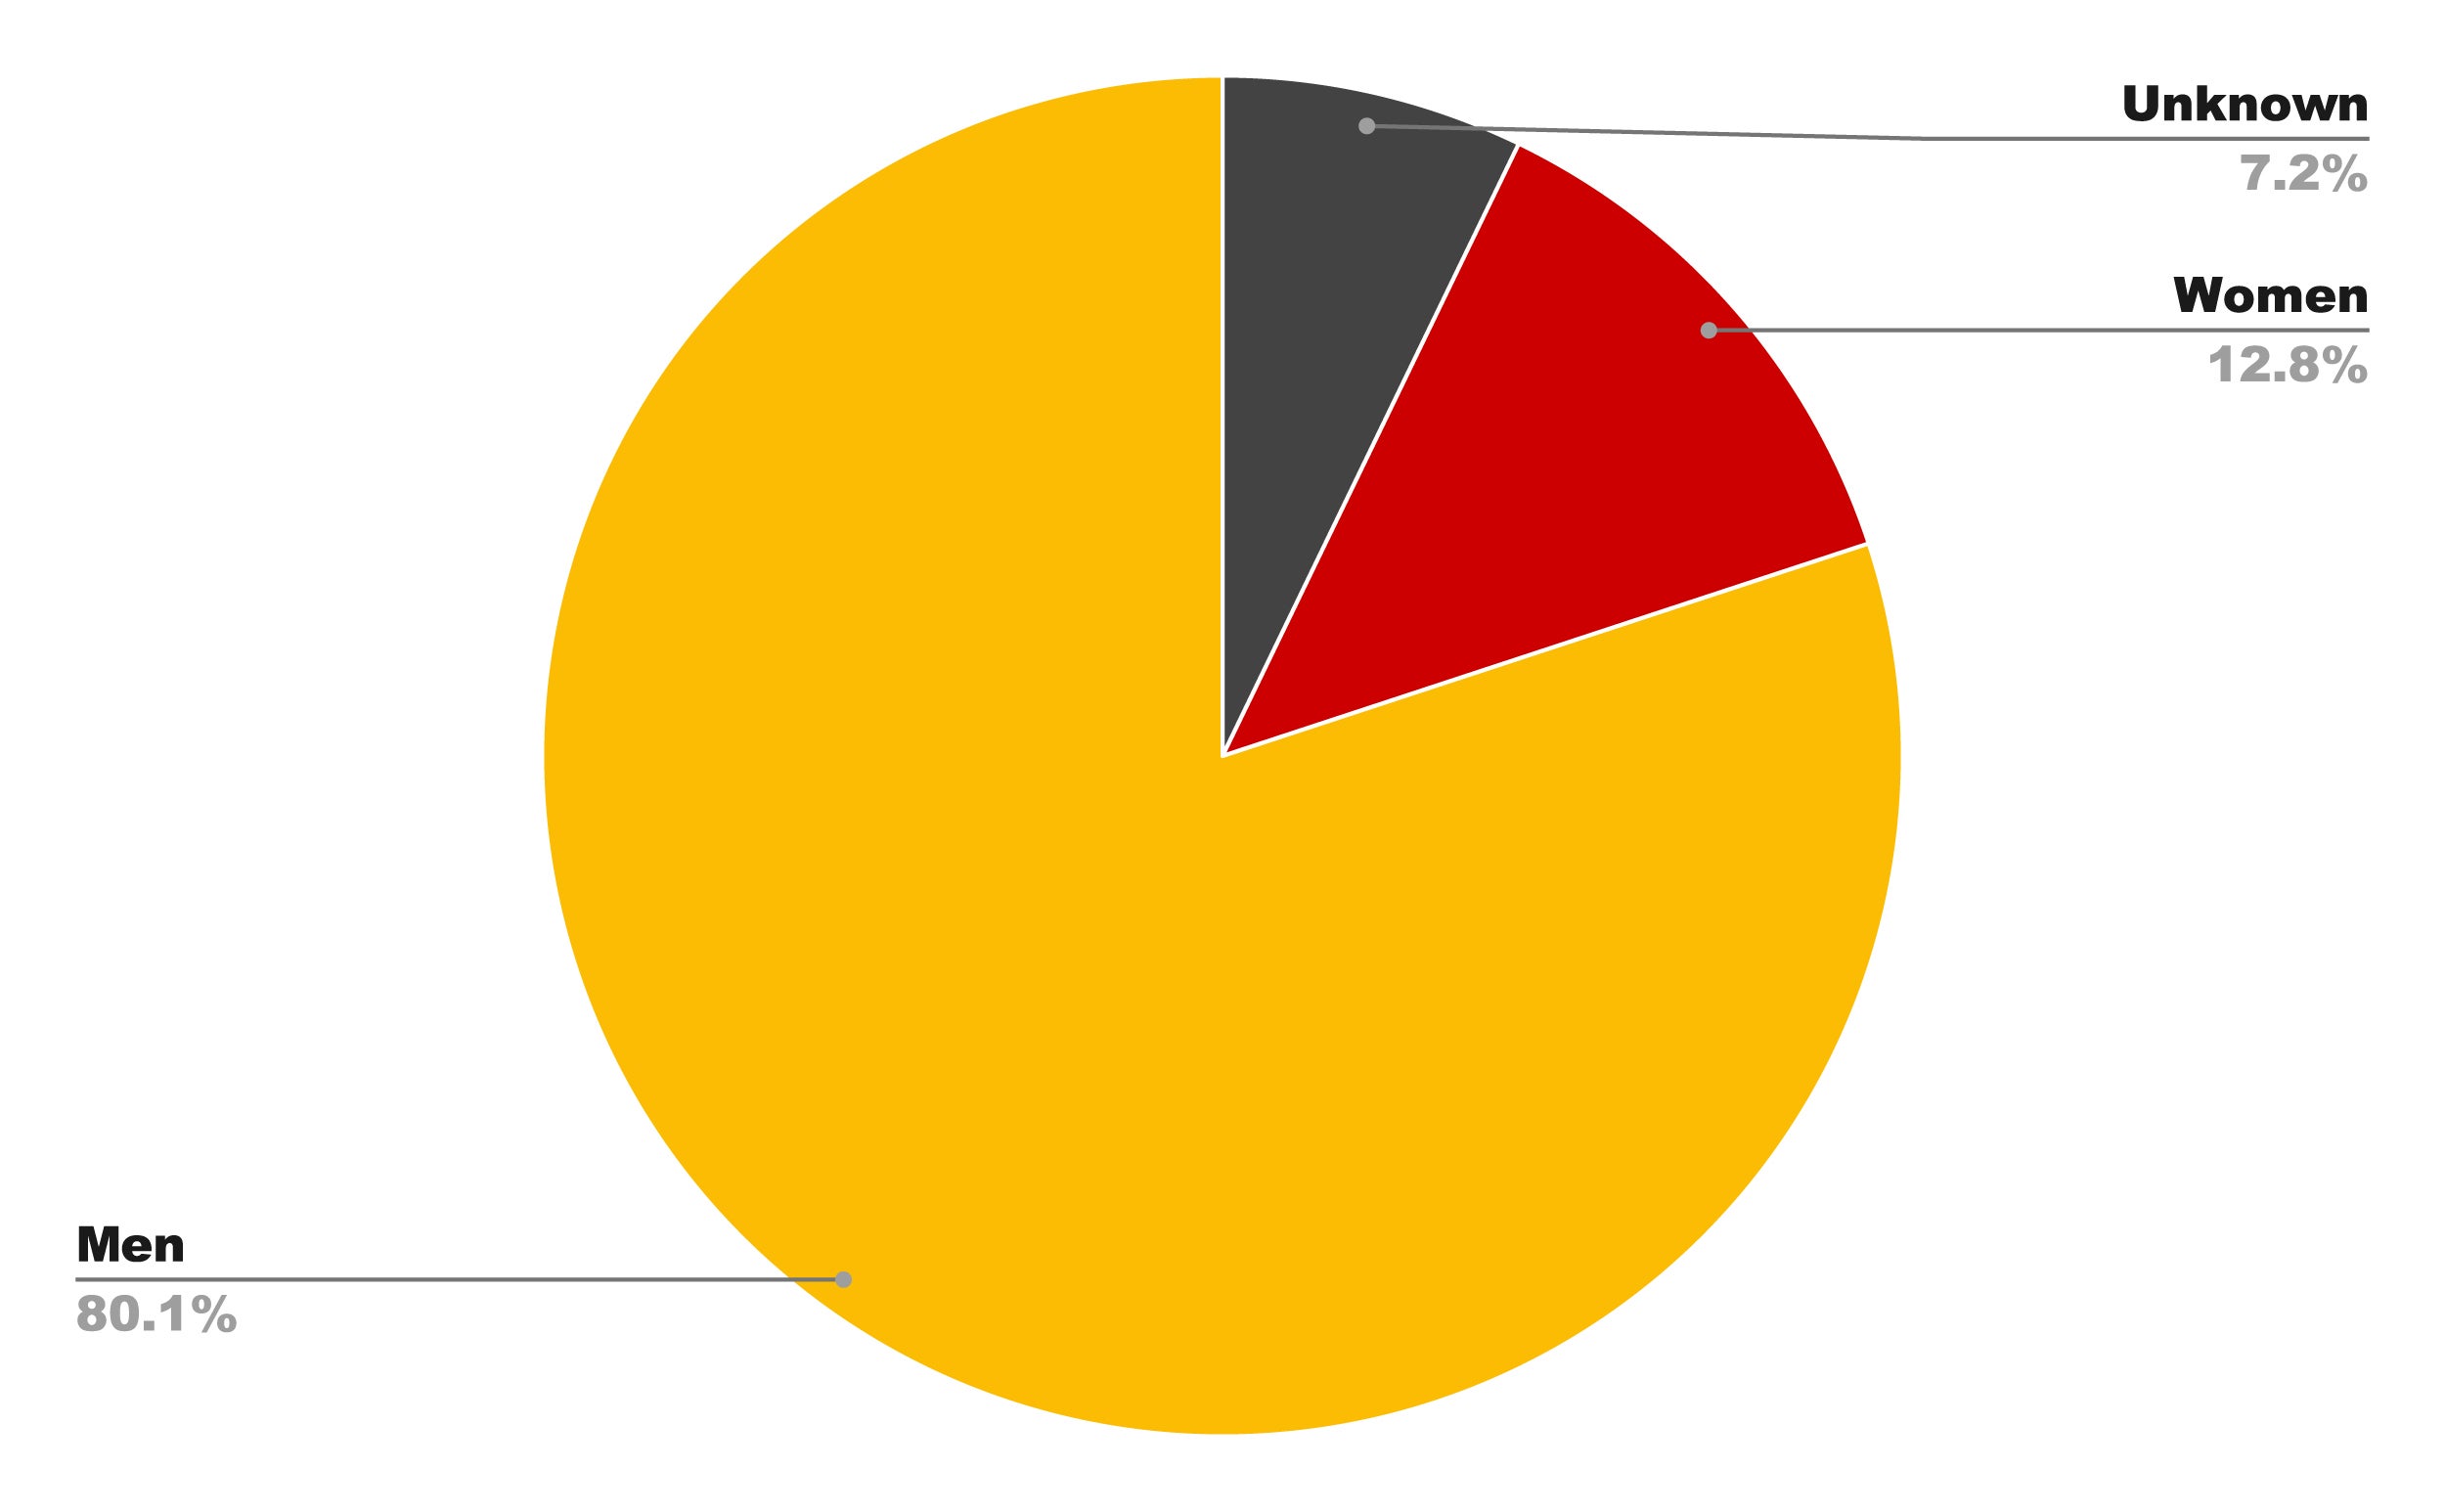
The vast majority were men.

(Jonathan Ver Steegh)

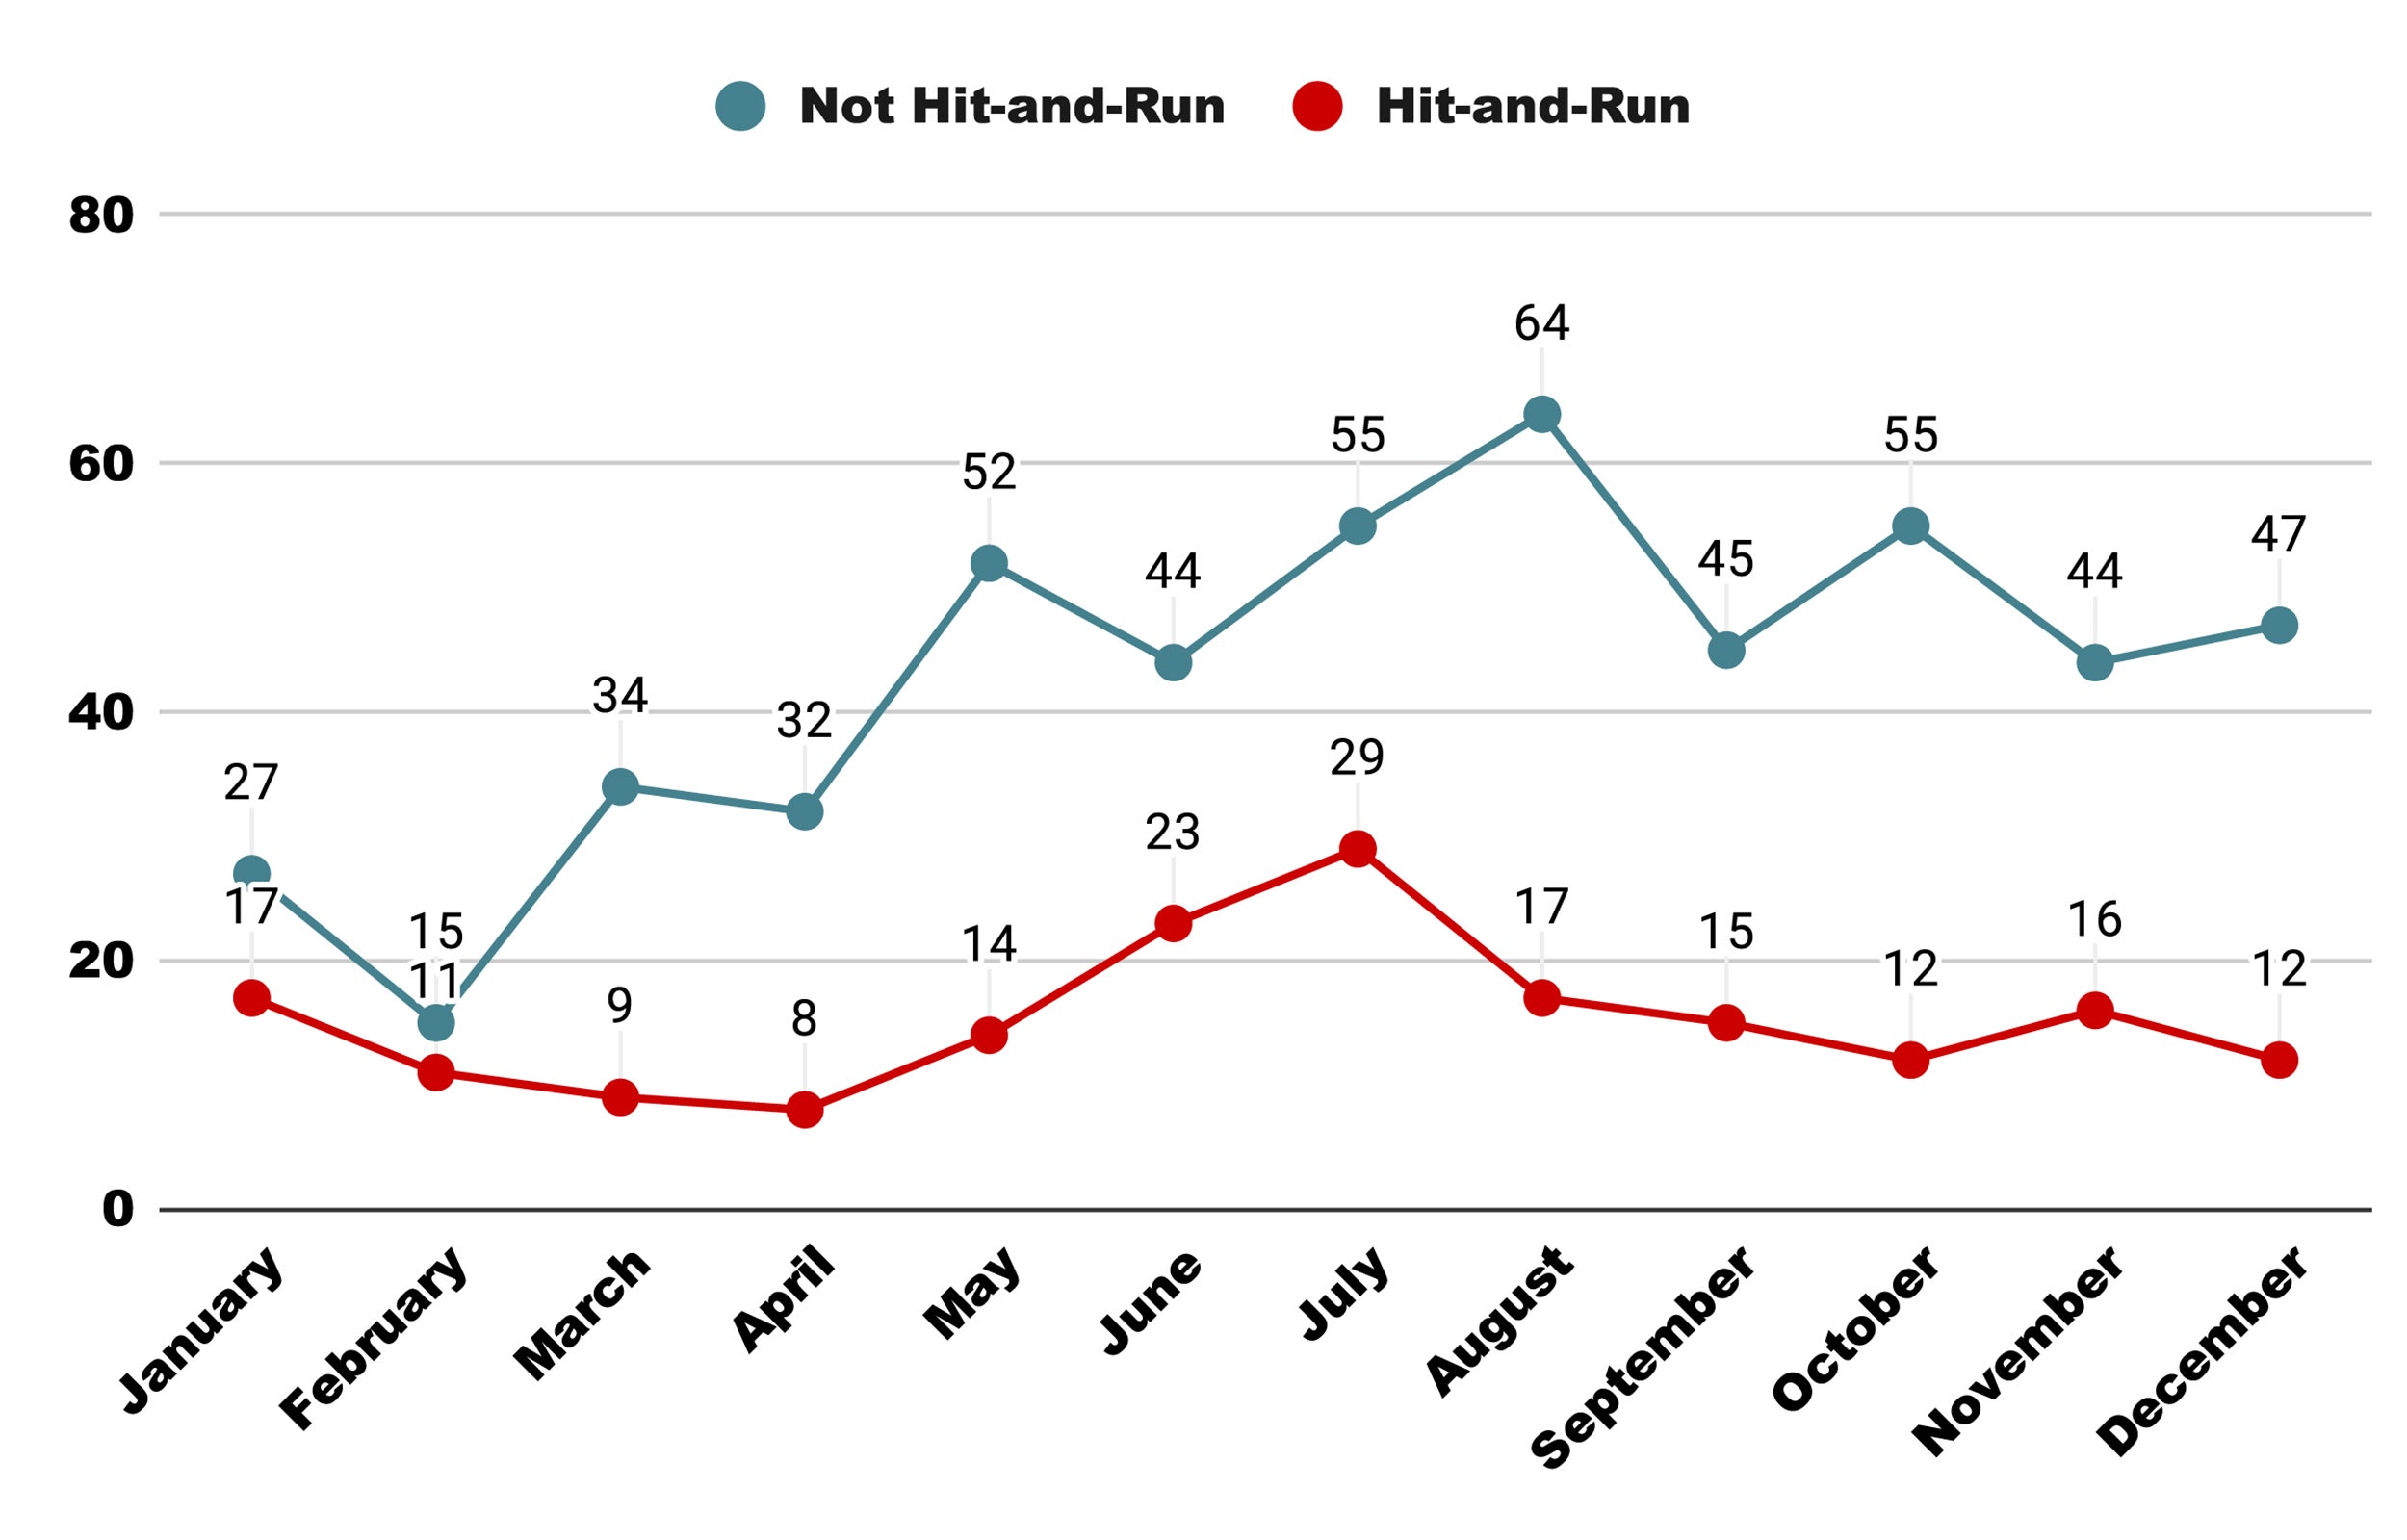
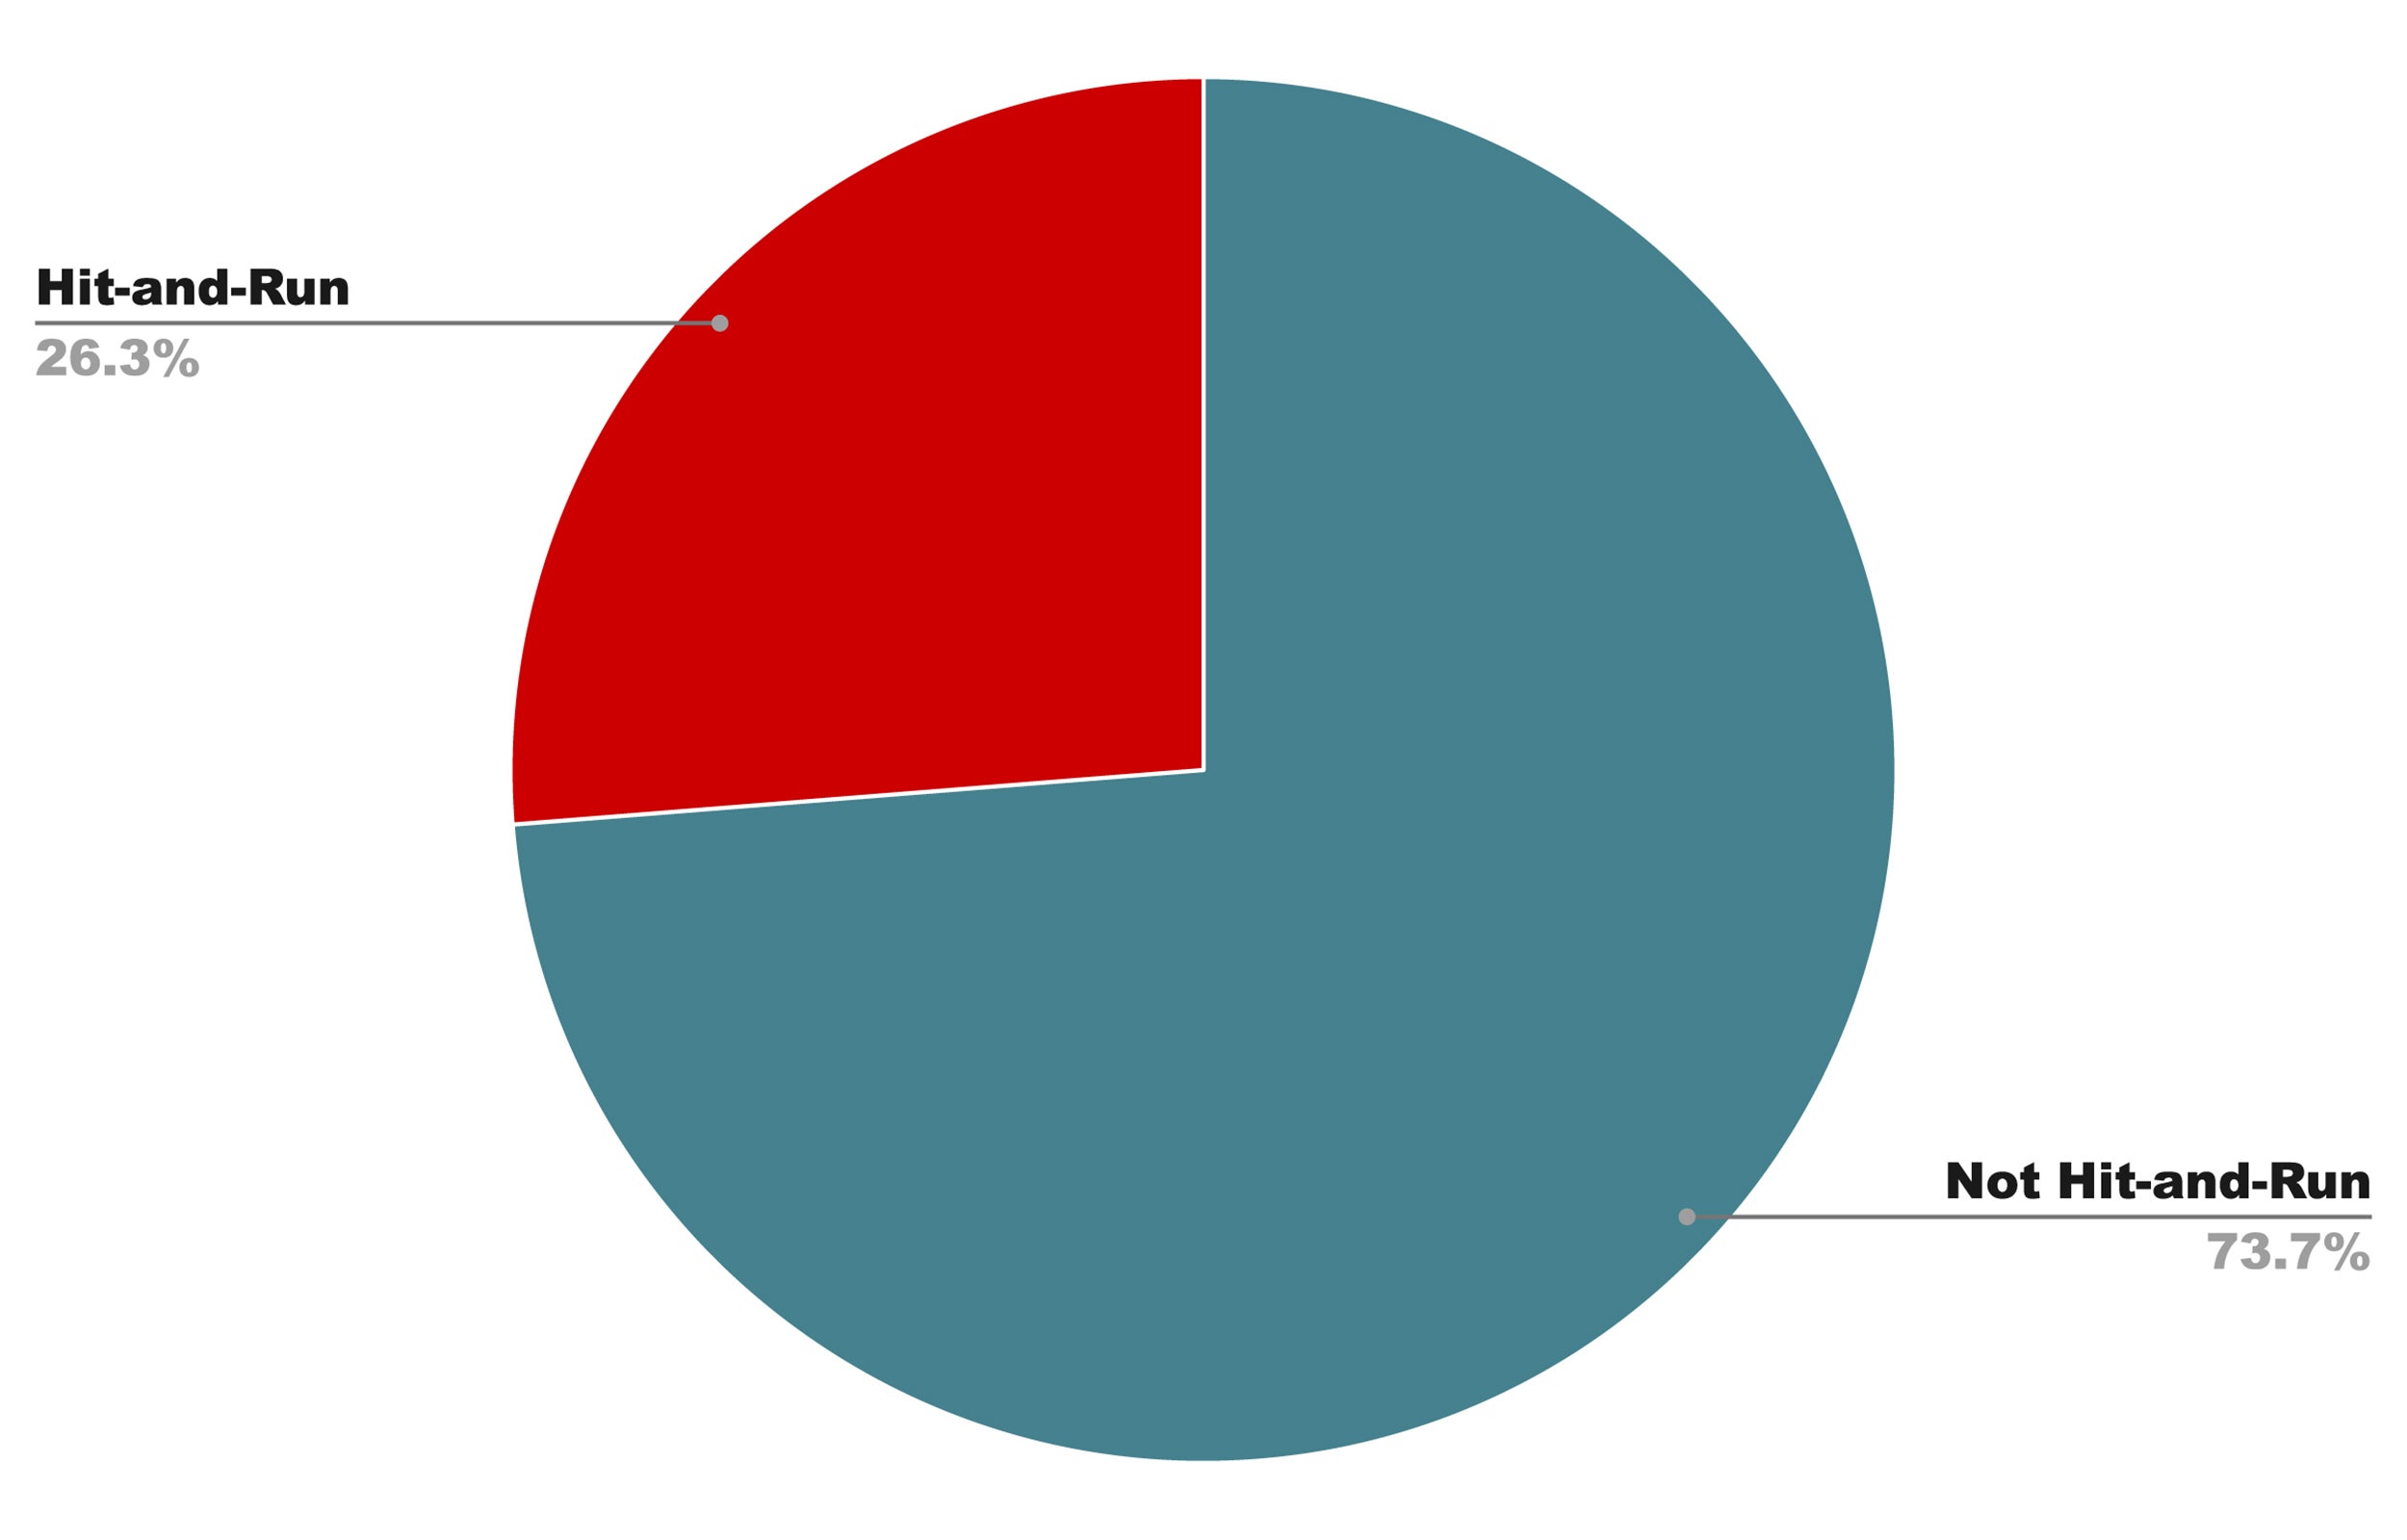
Percentage of Deaths That Were Hit-and-Runs

In more than a quarter of the crashes we recorded, the driver fled the scene.

(Jonathan Ver Steegh)

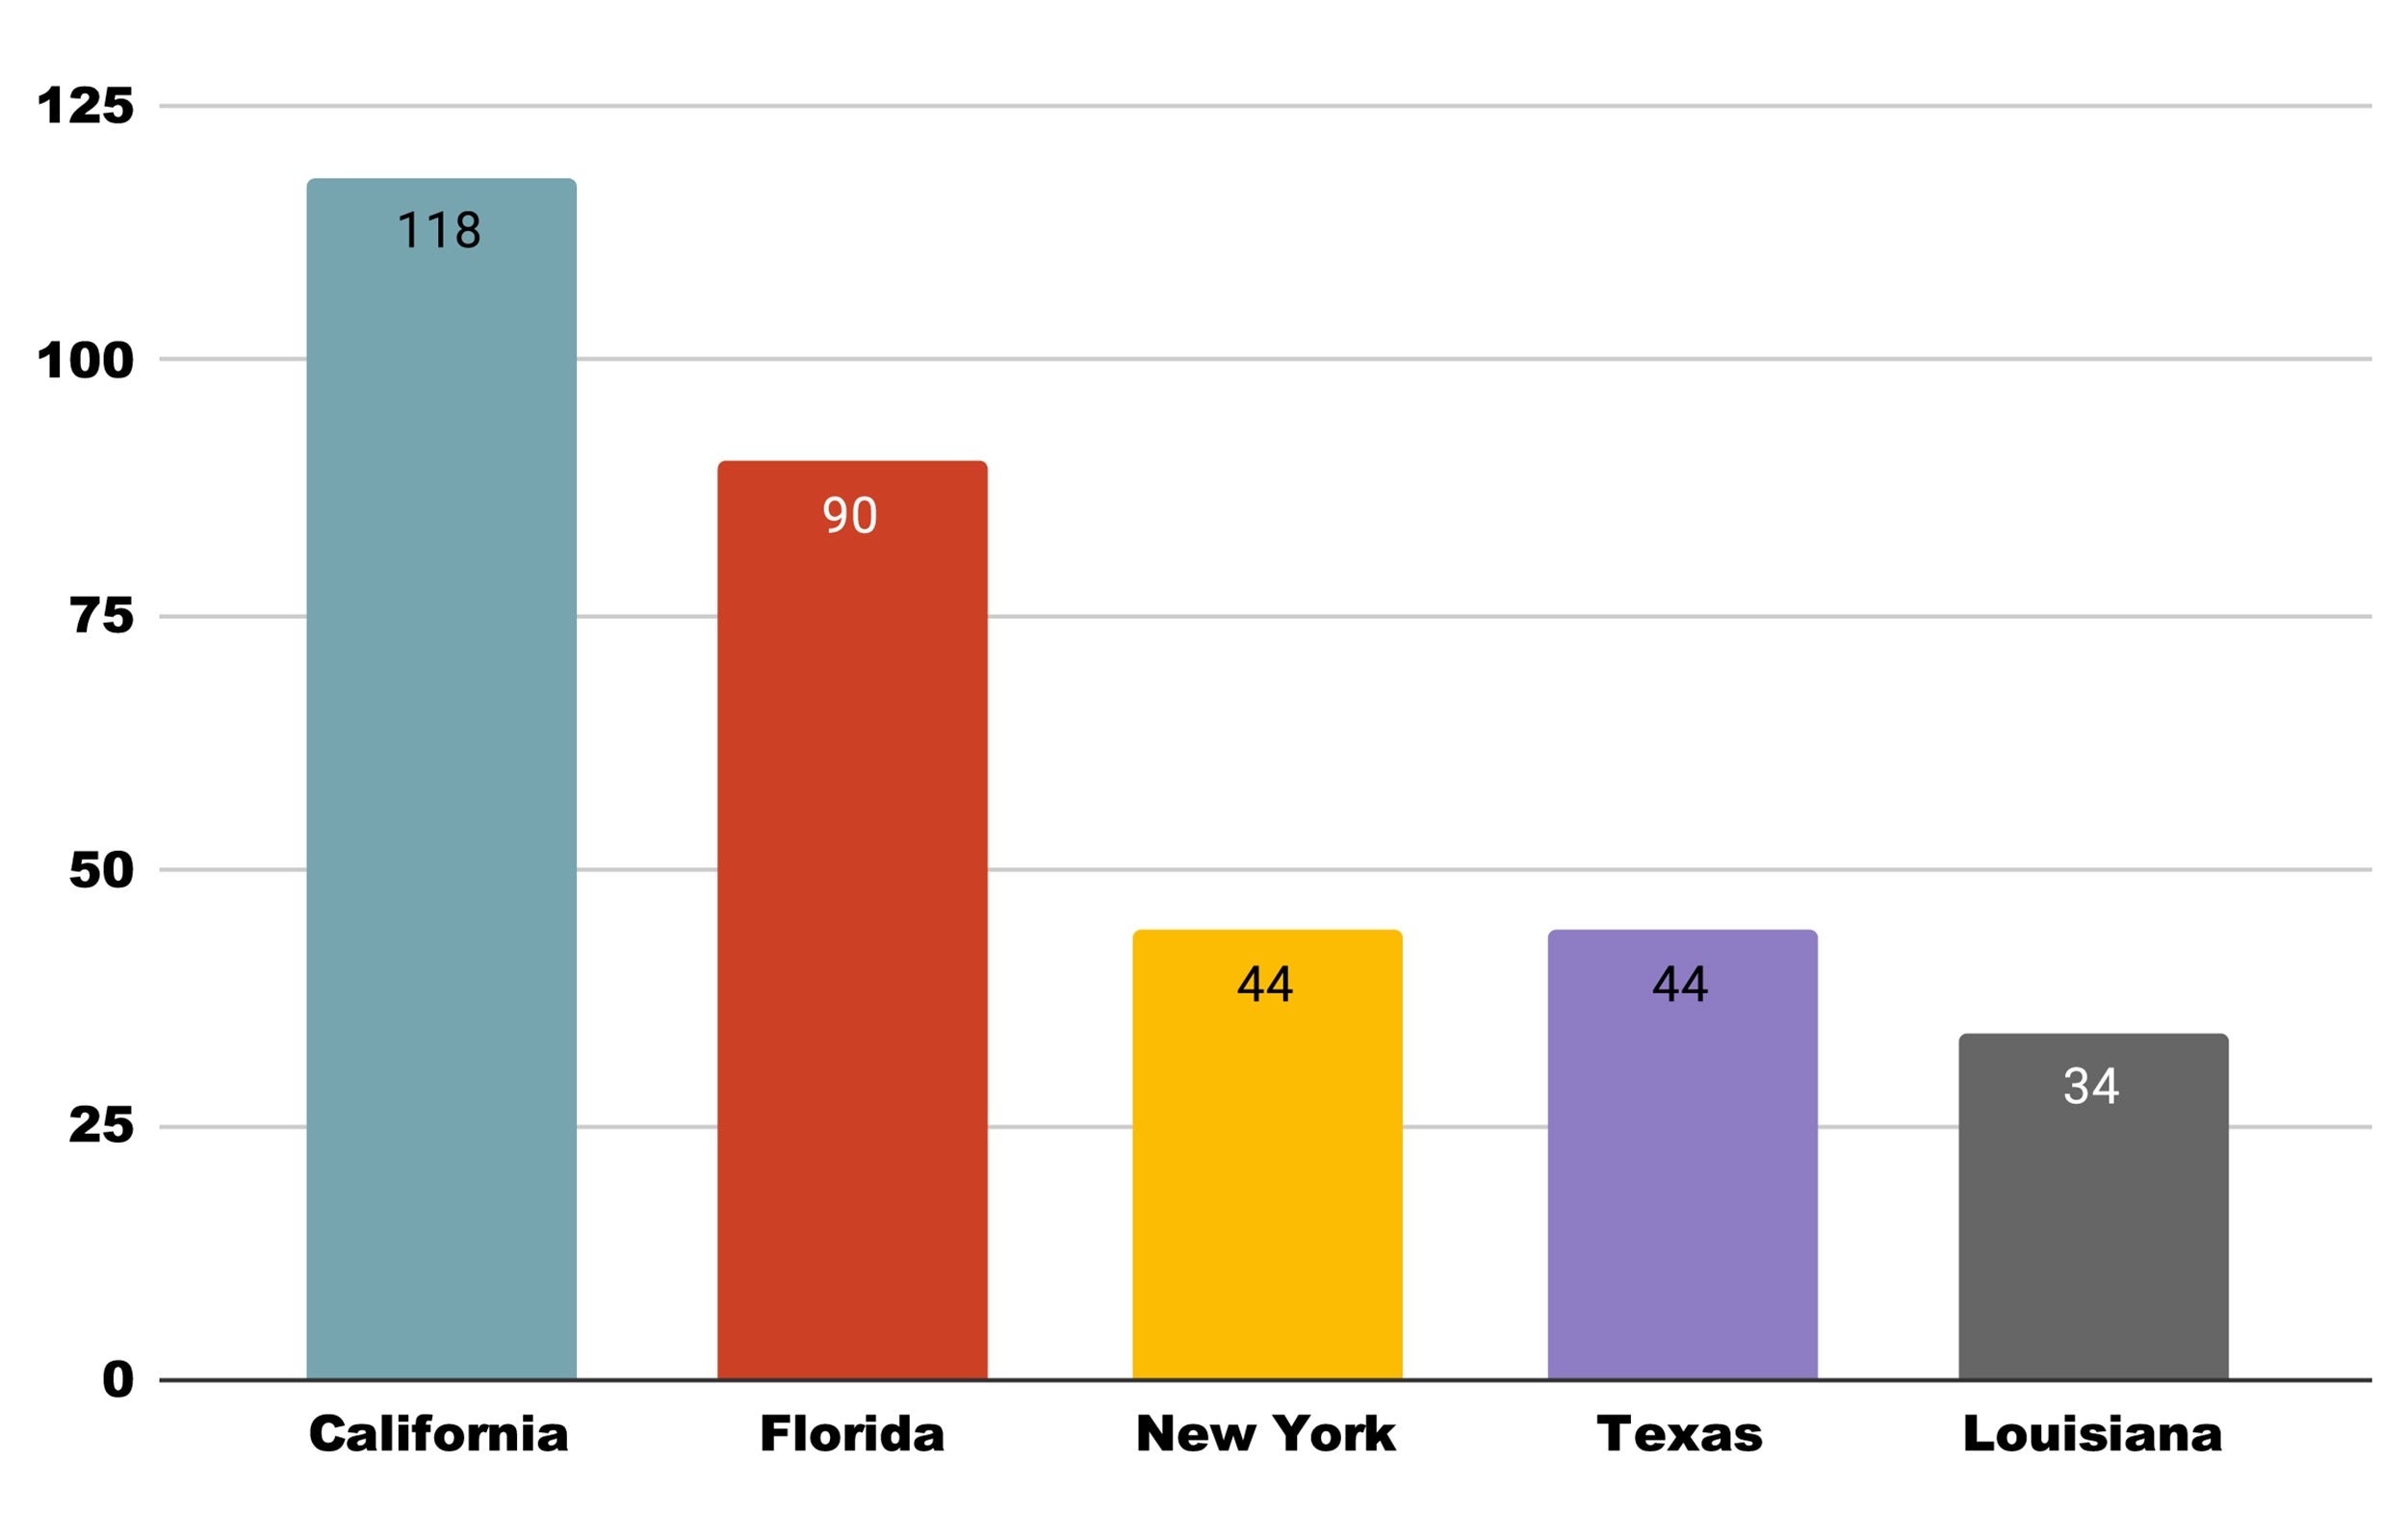
Where the Deaths Happened

We found that fatal crashes were occurring allover the country. We recorded deaths in 47states and nearly every major metropolitan area.

(Map data collected through December 31, 2020, by ϳԹ; map created by BikeMaps.org.)

States with the Most Total Deaths

Louisiana, New York, California, Florida, andTexas were the five deadliest states for cyclists in terms of total fatalities. The latter three have been the most deadlystates for cyclists for years, and New York’s fatalities have been on the rise as well—in 2019, it reported 46 cyclist deaths, alone.While these three statesare also the most populous in the country,Florida and California haveamong the mostcycling deathsper million people, as well. And Louisianarecorded 7.3cyclingdeaths per million people, the most of any state.Louisiana’s total fatal crash numbers have remained in the twentiesand thirtiesfor the past five years, according to data from the National Highway Traffic Safety Administration (NHTSA).

(Jonathan Ver Steegh)

Deaths by Location

Surprisingly, our data showed us that cyclists were dying from crashes in rural areas at nearly the same rate as in urban ones. Rural arterial roads can lack four-way-stop intersections with traffic lights and rarely have a shoulder for cyclists to ride along.

(Jonathan Ver Steegh)

Deaths by Road Type

The most dangerous place to be a cyclist, however, was on an arterial road, which we defined as a busy, multilane thoroughfare with traffic signals at intersections and speeds limits exceeding 30 miles per hour.Arterials accountedfor 65percent of the fatal crashes in our database. We saw that poorly designed intersections along these roadspresented serious hazards for cyclists. While many had multiple lanes for cars, they had none for bikes. Furthermore, many had speed limits as high as 45 miles perhour. (Speed limits have been increasing in many parts of the country.)And numerousintersections on arterialsallow vehicles to turn right on a red light, or have several turning lanes, which makes it much more likely that a driver won’t see a cyclist while they are turning.

BikeMaps.orgexecutive director Karen Laberee addsthat cars making unprotected leftturns—thosewith no dedicated left-turnlight—are especially hazardous, because a driver may be watching for other cars coming in the opposite directionbut not for cyclists or pedestrians. “A left turn is a particularly for a driver—there’s a lot going on for them to process,” Laberee says. One solution is to restrict concurrent movement, with separate light cycles for left-turning vehicles, vehicles driving straight, and pedestrians and cyclists, she says.That way, only vehicles or pedestrians are going through the intersection at one time.

(Jonathan Ver Steegh)

Some of the deadliest roads in the country were Military Trail in West Palm Beach, Florida; Beach Boulevard in Huntington Beach, California; and First and Second Avenues in Manhattan. These roads each had three cyclist fatalities in 2020, and we noted a couple factors that may point to why. Military Trail is a multilane arterial that only has a protected bike lane at some intersections; Beach Boulevard lacks a bike lane altogether; and First and Second Avenues are busy city streets with little room for cyclists, pedestrians, and vehicles to all share the road.

The Lockdown

Our data also showed a surge of deaths over the summer, with 84 in July—a 25 percent increase from June. Though it’s too early to be certain, the cycling boom that took place after the COVID-19 lockdown orders may have contributed to the summer death rate. From January through November, $4.9 billion worth of bikes were sold in the U.S., according to .In Los Angelesand Houstonalone, Strava found in cycling trips in both cities in May 2020 compared to May 2019. More cyclists on the road seemed to correlate with more people on bikes being killed by drivers.

Number of Deaths by Month

(Jonathan Ver Steegh)

Hit-and-Runs Over Time

There was also an increase in hit-and-runs starting in the summer.

(Jonathan Ver Steegh)

Where to Go from Here

Despite this harrowing data, we remain optimistic that safer roads for cyclists are possible.Across the country and the world, leaders are pushing legislation and expanding infrastructure projects tomake roads safer for users who are not in a car. These efforts were acceleratedby the pandemic’s impact on public transportation and how we now move about our communities. The Slow Streets movement,which started last spring as part of several cities’ COVID-19 responses, strivesto make more space on roads for pedestrians and cyclists. It across the U.S., includingOakland, California; New York City;and Washington, D.C. collected by the University of North Carolina found that nearly 300 temporary and long-term infrastructure projects were initiated in cities around the world in 2020 to createmore people-friendly streets, with about a third of themin the U.S.; initiatives included closing roads to vehicle traffic and converting some vehicle lanes exclusively for walking and cycling use.

While local governments across the nationhave been taking action to make streets safer, the new presidential administration will hopefully add federal support to the effort as well. Under President Obama, the National Highway Traffic Safety Administration the agency’s New Car Assessment Program (NCAP) to better address how to make carssafer for people outside the vehicle, not just those inside. We’d like to see President Biden continue this effortand follow through on his to install zero-emissions public-transportation options, including infrastructure for cyclists and pedestriansin cities with at least 100,000 people. “It’s expensive, political, and there are limited budgets—all factors making [changes] harder to implement—but there is a will for making cities better,” saysNelsonof BikeMaps.org.

Here is what we hope local and federal governments will do to address the unacceptable number of cyclists and pedestriansdying on our streets:

  • Devote serious toward protected bike lanes and intersections. Separating cyclists from pedestrian and vehicle traffic is crucial to keeping everyone on our streets safer. One found that cities with protected bike lanes cited higher safety records for all road users. Unlike standard bike lanes, provide a physical barrier (such as a curb, raised bump, or delineator posts)between the bike lane and the vehicle roadway. City planners should also connect preexisting bike lanes to establisha more efficient flow of traffic and prevent cyclists from riding on roads with no bike infrastructure.
  • Incorporate a car’s potential riskto cyclists and pedestrians withvehicle-safety ratings. The work of the Obama administration to revise the NCAP to address pedestrian and cyclist safety was a step in the right direction, but it must be continued. It’s important for drivers to understand how avehiclethey’re about to purchase could injure another person in a crash.
  • Improve education for drivers.People behind the wheelmay not fully realize the risk they take when driving distracted or tired. In 2017, the NHTSA that 91,000 police-reported crashes involved drowsy drivers. Driver’s ed schools should include mandatory lessons on distracted or tired driving.
  • Incentivize cycling. Cycling, in addition to being a great form of exercise, also makes a city cleaner and healthier. have encouraged their employees to bike more by giving them bikes or paying employees to ride to work instead of driving. Coupled with better bike infrastructure, incentivization programs like the 1993 , which offered reimbursements on biking expenses for cyclists, would get more people motivatedto travel this way.

A Note on Our Methodology

We tracked cyclist deaths for the project by checking news databases and local-news archives on a weekly basis, as well as through emailed tips from readers. We recorded the data in real time, with an understanding that not every death is reported by news outlets, so it is likely that there were more deaths in 2020than we’ve reported here.

We characterized a crash location by analyzing Google Street View; a location was determined to be suburbanif it was surrounded by swimming pools, golf courses, cul-de-sacs, or strip malls; urbanif it was inside city limits, laid out in a grid, and there were no suburban indicators;and ruralif the area was mostly surrounded by open space, trees, or fields.

Finally, we determined a road to be arterial if it had stoplights and speeds of up to 45 miles per hour. We did, however, consider rural, two-lane roads with speed limits under 50 miles per hour to be arterialsas well.