


There is a right way to backpack. You should equip yourself with the gear, supplies, and skills that are appropriate for the conditions and your trip objective.
Among the conditions that I consider (there are ), the weather has an outsized role on my preparations. It affects my clothing, shelter, and sleep and can sometimes change by the hour.
It’s easy to find the weather forecast, seasonal averages, and daily records for population centers. Accurate data for backcountry locations can be scarce—there are fewer weather stations in remote locations, and mountains make their own weather, causing conditions to vary significantly with elevation and geography.
So how do I familiarize myself with the weather conditions I’ll likely encounter on a backcountry trip? Glad you asked.
Weather That Matters
When I look at weather data, I’m interested mostly in temperature and precipitation. More specifically, I want to know the average high and low temp and extreme highs and lows, plus the frequency, amount, and pattern of precipitation.
Humidity and wind are also important, but it’s more difficult to find this data outside of a short-term forecast. So, on that front, I run with some assumptions:
- Locations east of the 100th meridian—the line that roughly bisects the Midwest from north to south—and coastal areas in the Pacific Northwest and Alaska are humid.
- Locations west of the 100th meridian are dry, except when storms roll off the Pacific (mostly between November and April).
- The plains are the windiest region in the country. Ridges and peaks are also wind-prone, especially when storms are passing through or when weather systems are changing.
- If I can find a protected campsite (among natural wind breaks like trees or canyon walls), wind is usually not a significant factor at night.
Considerations for Trip Length
For shorter trips, I base my planning around weather averages and normal extremes and then tweak my selections at the last minute based on an actual forecast. Conditions are most likely to be average, but I need to be prepared for abnormal weather.
On longer trips, I expect average conditions overall, but more extremes. For example, on a three-month thru-hike, I might experience eight weeks of average conditions, two weeks of abnormally wet and cold conditions, and two weeks of abnormally warm and dry conditions. Overall, the conditions will be average throughout the trip, but I will see more variability than I would on a shorter excursion.
How do I define trip length? A “short” trip is anything less than about five days, which is the normal outer limit of my trust in weather forecasts. Between five and ten days, forecasts can be suggestive (for example, a storm front will arrive in about a week), but I take them with a grain of salt. A “long” trip is anything beyond ten days, when the weather becomes anybody’s guess.
Short-Term Planning
The night before I depart for the backcountry (and sometimes even the morning of), I always get a weather forecast. Knowing the weather will not change the weather, but it may change my decisions, like where I camp and the boldness of my route. My preferred source of information is the . Yes, I still believe in our institutions.
The forecast for the town closest to my route will not necessarily be relevant, so instead I get a “point forecast” by clicking on a more specific location on the embedded map. Depending on the route, I may grab several forecasts, like for high and low points, and for opposite sides of a weather-making divide.
Here’s a forecast I pulled in early June for Grand Lake, Colorado, the western gateway town to Rocky Mountain National Park:
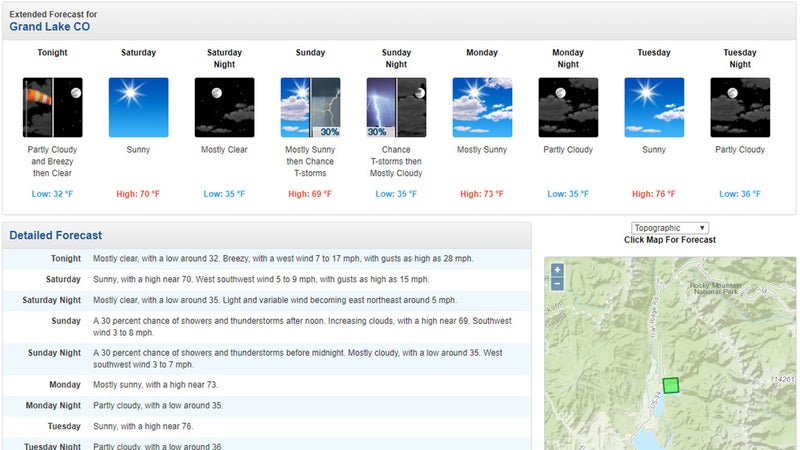
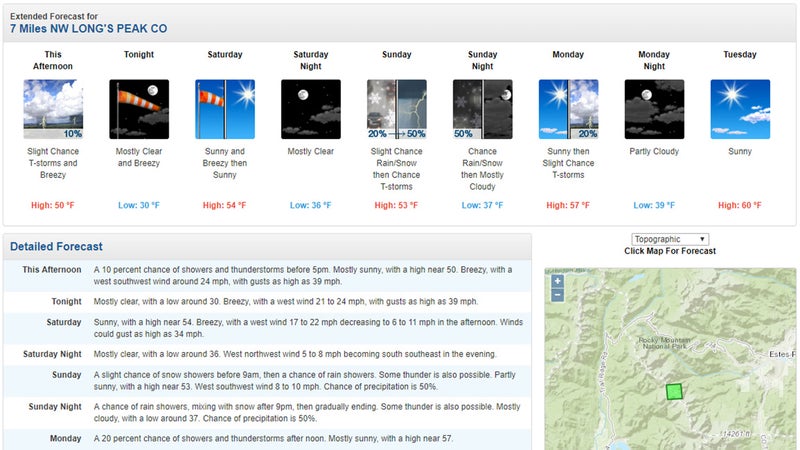
But along the Continental Divide Loop at 12,000 feet, where I’d be hiking, the forecast is more severe. The daytime highs will be 15 degrees cooler, and over the weekend there was a higher chance of rain and even snow:
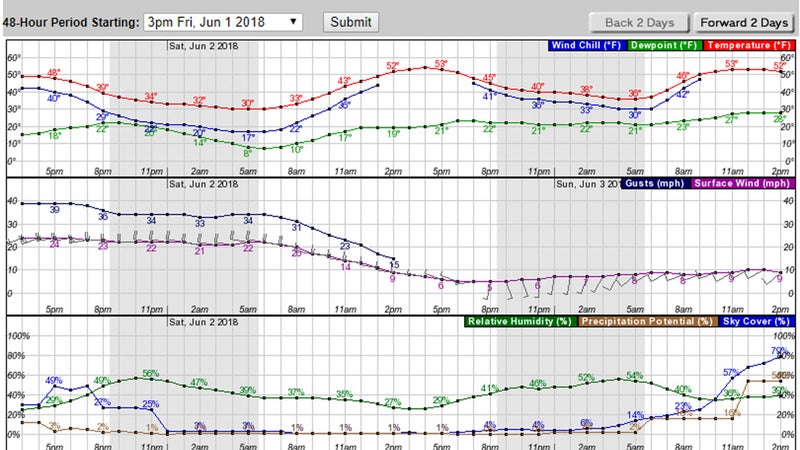
To better understand the timing and severity of inclement weather, I may look at the hourly weather forecast, listed under “Additional Resources.” I find this graph to be more useful than vague descriptions like “chance of rain showers, mixing with snow after 9 p.m.” I sometimes will also read the forecast discussion, which gives more color and macro context to the data.
In addition to the NWS, several other resources are worth mentioning. Some are relevant only for particular seasons or locations.
- Avalanche information centers, like the
- Summit stations, like the
Long-Term Planning
In my experience, short-term forecasts are not always spot-on, but they’re usually accurate enough to assemble a proper kit and set trip expectations. For example, the forecast may underestimate the amount of rainfall, but it still predicts rain, and so I would take my rain gear and an appropriate shelter.
But normally I can’t wait until the last minute to gear up. For example, if I plan to leave after work on Friday, I’ll want to pack earlier in the week. And if I were thru-hiking the Pacific Crest Trail, I couldn’t wait until the day before to purchase my gear, especially since some cottage companies have wait times of several months.
Where exactly do I find seasonal averages?
National Center for Environmental Information
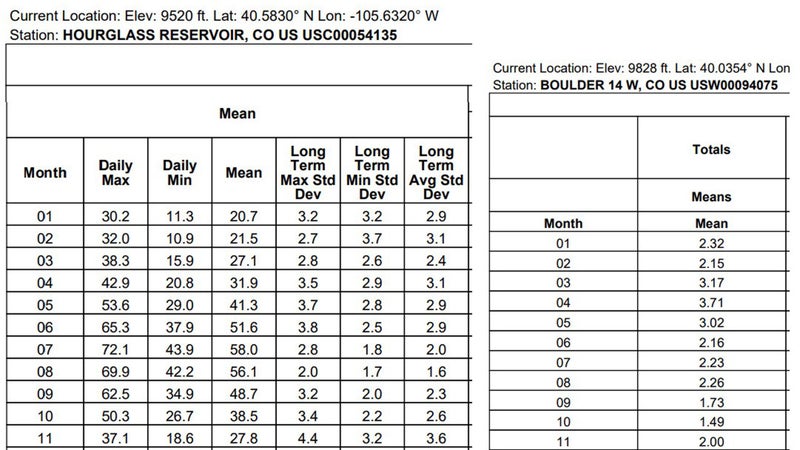
For most of the country, I start with the National Centers for Environmental Information (NCEI), a division of the National Oceanic and Atmospheric Administration. More specifically, I dig into the monthly climate normals for its COOP stations from 1981 to 2010, using its or .
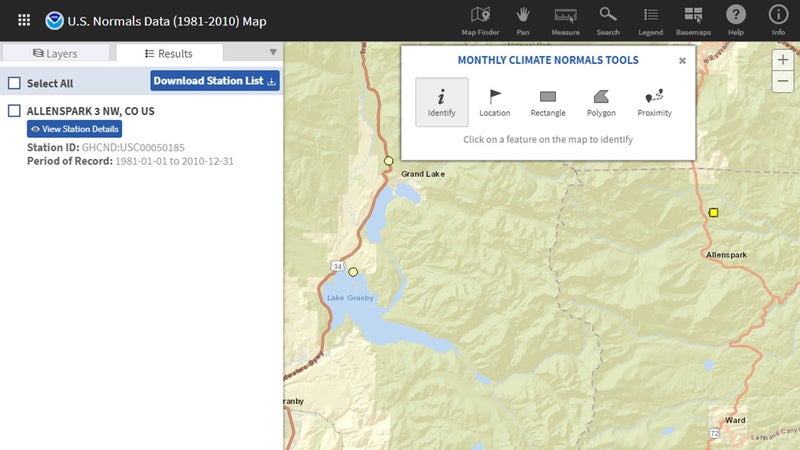
The intuitiveness of both tools needs improvement, but they’re sufficient. To retrieve the desired data from the NCEI, you may have to play around with its tools for a while. Hint: Find a relevant COOP station, add the data to your cart, and “check out.” It’s free, and you’ll receive an email with a download link. The CSV or PDF file will contain data like this:
SNOTEL
The Natural Resources Conservation Service (NRCS), a division of the Department of Agriculture, operates more than 800 automated data collection sites, primarily in the western United States and Alaska. Data from the Snow Telemetry (SNOTEL) Network is used for water supply forecasting, maps, and reports.
To find SNOTEL sites, use and turn on the “SnoTel Sites” layer. Then find one (or a few) close to your route.
SNOTEL stations record and monitor temperature, precipitation, and snowpack. To retrieve temperature and precipitation data, I like to use its .
California
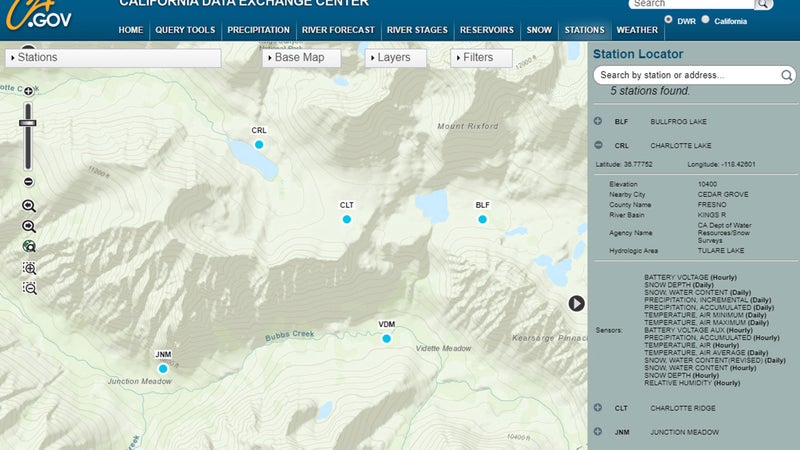
The state of California has its own monitoring system for weather, snowpack, and river and reservoir levels, managed by the Department of Water Resources. Start with the , and work with the tools provided to get useful data.
Data Adjustments
Temperature and precipitation normals that are retrieved from NCEI, SNOTEL, and California are station-specific. If these stations are close but not on your route, adjust the data to make it more relevant.
Temperature: For every 1,000 vertical feet of elevation gain, deduct three to five degrees Fahrenheit—three degrees for humid climates, four degrees for semiarid, and five degrees for arid.
Precipitation: Rainfall and especially snowfall increase exponentially with changes in elevation and geography. Locations that are higher and are on the “wet” side of a major divide will receive significantly more rainfall and snowfall than lower locations in the rainshadow of that divide.