
Earlier this year, an caused power outages in thousands of homes, a , and . It was one of the nastiest weather events of the season, but it was notable for another reason: it was the first to be tracked by . Launched last November, the that will dramatically improve the weather data available to scientists and meteorologists. This means everything from more accurate forecasts for powder chasers’ weather apps to of hurricanes rolling toward the eastern seaboard. “For forecasters, these satellites are the most critical tools we have,” says Joe Pica, director of ’s office of observations. “The GOES-16 is game-changing.”
How does it work? By taking 16 simultaneous snapshots of a weather system through sophisticated filters that show everything from real-time forest fires to developing dust storms. Here, one of GOES-16’s developers, Tim Schmit, walks us through four images captured during that January storm.
High-Speed and High-Def
GOES-16’s images are four times more detailed than previous U.S. weather satellites’, and it can transmit pictures back to earth every five minutes. (In the past, it took 15 minutes.) This provides an exceptionally accurate idea of when and where severe weather, like that ice storm over the Midwest, will hit hardest.
Cloud Cover
In this view, white clouds become dark if they contain ice. This can help predict which weather systems could turn into large storms. Clouds cooling at a faster rate are likely morphing from cumulus to massive cumulonimbus, which lead to severe weather.
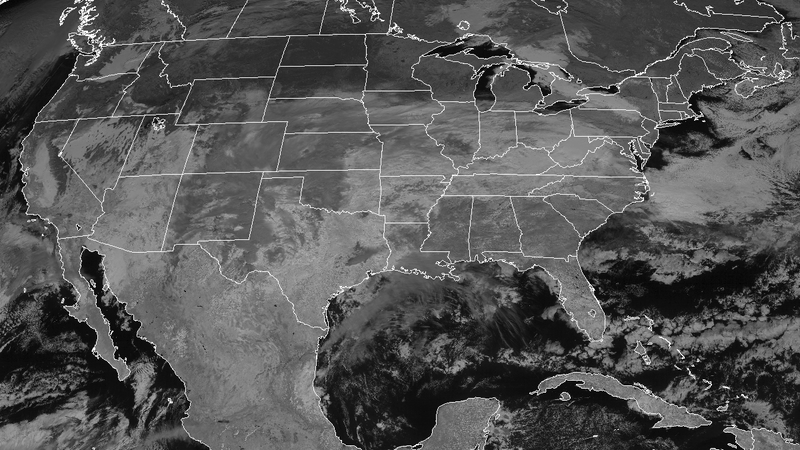
Heat Sensitivity
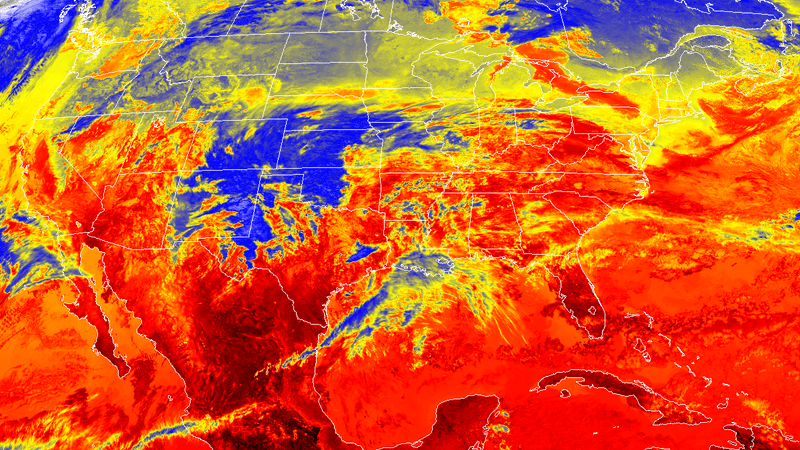
This infrared image shows variations in temperature. Pinpointing hot spots could allow emergency responders to react to fires and evacuate surrounding areas before smoke is even visible to humans. Obviously, it’s not that hot during an ice storm.
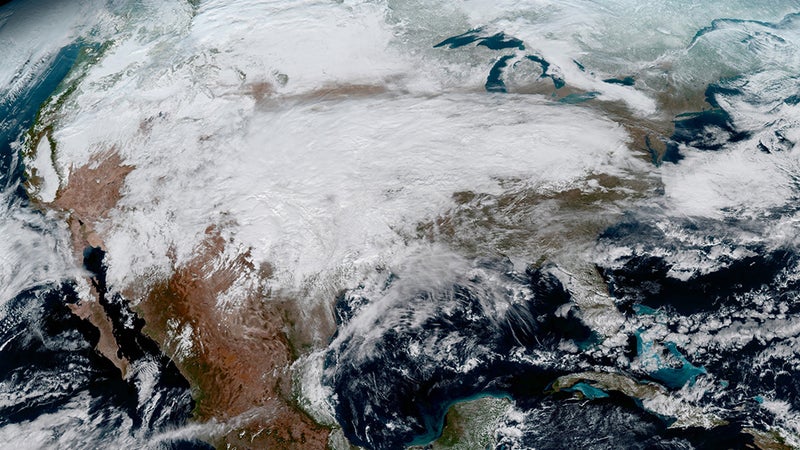
Moisture Content
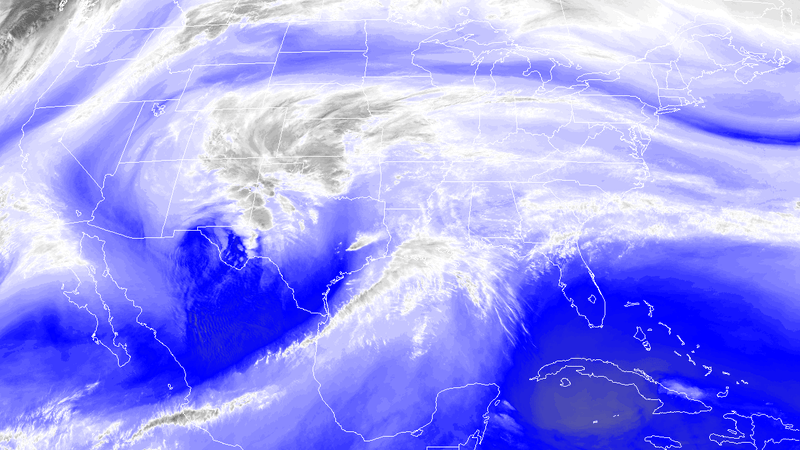
This image shows water vapor, which can turn into clouds. You can see moisture from the Gulf of Mexico wrapping counterclockwise into the Midwest. This data can help forecasters tell if a storm will get stronger or dissipate. In this case, it’s getting stronger.