

Nobody checks the weather forecast more obsessively than a marathoner with a race coming up. We’re all dreaming of (as ���ϳԹ���’s Martin Fritz Huber so poetically put it in a recent column) “that perfect meteorological cocktail—temps in the low 50s, dry, a tailwind that magically follows you around like a forest sprite.”
But what are the precise ingredients of that ideal cocktail? There has been plenty of research over the years attempting to nail down the best temperature—but even the top scientists in the world haven’t reached a consensus. During Eliud Kipchoge’s first attempt at a sub-two-hour marathon back in 2017, for example, the starting temperature of 52 degrees Fahrenheit was seemingly too hot , but just right . And what about the roles of humidity, wind, and even solar radiation?
A , from a group led by Andreas Flouris of the University of Thessaly in Greece, attempts to tackle all these questions at once by applying machine learning to a massive database of nearly a century’s worth of race results. The resulting insights offer a surprisingly practical guide to just how much you can expect to slow down in a given set of adverse weather conditions.
The researchers collected results from major competitions for the marathon, 10,000 meters, 5,000 meters, and 3,000-meter steeplechase, as well as the 50K and 20K racewalks. That included Olympics, World Championships, Diamond League track meets, World Athletics Gold Label road races, and other events of that nature going back as early as 1936. Accurate weather records were collected for each competition, and the results for elite athletes (top three) and well-trained runners (25th, 50th, 100th, and 300th place) were compared against the event record at the time of the competition. There are some obvious limitations to that approach: times will be affected by tactical races and other factors like altitude (e.g. at the Mexico City Olympics in 1968). But across a large dataset, this gives you a sense of how much the weather in a given year affects times.
The four major elements of weather were air temperature, relative humidity, wind speed, and solar radiation (adjusted for cloud cover). These can be considered independently, or in composite indices like the Wet-Bulb Globe Temperature (WBGT), which is a weighted average that factors in all four parameters.
There’s a whole bunch of mathematical analysis in the study, using different approaches (including a machine learning method called a decision tree regressor algorithm) to sift through all the data and look for meaningful patterns. I’m not going to go through all of it (the paper is if you’re interested in digging deeper), but there are a few highlights I want to pull out.
The simplest question is how often athletes run in good or bad weather. Using existing World Athletics classifications based on WBGT, the researchers found that 27 percent of the races studied took place in cool conditions, 47 percent in neutral conditions, 18 percent in moderate heat, 7 percent in high heat, and 1 percent in extreme heat. We can probably expect the number of competitions in unpleasant heat to increase in years to come, but for now this means you’ve got a roughly 50-50 chance of getting served that perfect meteorological cocktail for any given race.
The machine learning algorithm also offered an estimate of how important each weather parameter was for performance. Not surprisingly, air temperature was the biggest factor, earning a “feature importance score” of 40 percent. Next was relative humidity (26 percent), solar radiation (18 percent) and wind speed (16 percent). In keeping with a study I wrote about last year, that suggests that cloud cover is as important as a lack of wind for running fast. That obviously depends on other factors too: cloud cover is more important on a hot day than a cool one, whereas a headwind will slow you down no matter what the temperature is.
As for the meteorological sweet spot, the overall conclusion was that a WBGT between 45.5 and 59 degrees Fahrenheit is best. That’s interesting, because the World Athletics guidelines consider “neutral” conditions to be a WBGT between 50 and 64.4 degrees. For running fast, the best temperatures do seem to be a little cooler than previously thought. If you venture outside this zone, expect to slow down by about 0.3 to 0.4 percent per degree of WBGT. Of course, few of us have easy access to WBGT measurements. If you look at air temperature alone, the sweet spot is between 50 and 63.5 degrees, which is a little warmer than I expected.
There are further nuances if you look at individual events, though. The shorter running races seem to be less affected by heat: the peak WBGT for 5,000 meters is 59 degrees; for 10,000 meters it’s 50 degrees; and for the marathon it’s 45.5 degrees, which is getting chilly. (Racewalking is a different story: it’s a less efficient motion than running, meaning that a greater fraction of the energy you burn is lost as heat, which is thought to be why the majority of heat illness episodes at elite track meets happen to racewalkers.)
Finally, the practical bit. Here’s a table prepared by the authors that shows, for marathoners at various paces, how much you should expect to slow down based on air temperature, WBGT, or .
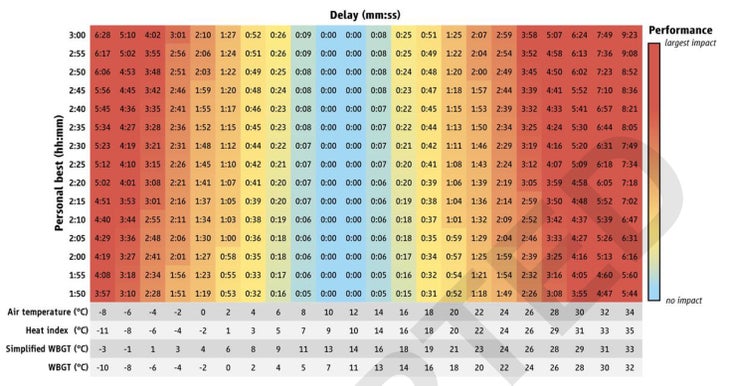
These calculations are based on very elite runners, who are different from you and me. They run fast, which generates a ton of heat and may favor cooler temperatures. Conversely, they don’t carry around a lot of insulation, which may predispose them to preferring warmer temperatures. That said, you can make rough extrapolations from this chart: if the weather conditions suggest that a two-hour marathoner will slow down by two minutes, you can estimate that a four-hour marathoner might slow down by somewhere in the ballpark of four minutes—but bear in mind that your mileage may vary.
For more Sweat Science, join me on and , sign up for the , and check out my book.