


I used to have a stock comeback to people who’d ask me to write an article about the amazing endurance-enhancing properties of eye of newt or toe of frog or whatever. “Send me the results of a peer-reviewed, randomized, double-blinded trial,” I’d say, “and I’d be happy to write about it.” But then they started to call my bluff. In much the same way that , there’s a study out there somewhere proving that everything boosts endurance.
A (a journal article that hasn’t yet been peer-reviewed, ironically) from researchers at Queensland University of Technology in Australia explores why this seems to be the case, and what can be done about it. David Borg and his colleagues comb through thousands of articles from 18 journals that focus on sport and exercise medicine, and unearth telltale patterns about what gets published—and perhaps more importantly, what doesn’t. To make sense of the studies you see and decide whether the latest hot performance aid is worth experimenting with, you also have to consider the studies you don’t see.
Traditionally, the threshold for success in studies has been a p-value of less than 0.05. That means the results of the experiment look so promising that there’s only a one-in-20 chance that they’d have occurred if your new miracle supplement had no effect at all. That sounds relatively straightforward, but the real-world interpretation of p-values quickly gets both complicated and controversial. , a study with a p-value just under 0.05 actually has about a one-in-three chance of being a false positive. Worse, it gives you the misleading impression that a single study can give you a definitive yes/no answer.
As a result, scientists have been trying to wean themselves off of the “.” One alternative way of presenting results is to use a confidence interval. If I tell you, for example, that Hutcho’s Hot Pills drop your mile time by an average of five seconds, that sounds great. But a confidence interval will give you a better sense of how trustworthy that result is: while the mathematical definition is nuanced, for practical purposes you can think of a confidence interval as the range of most likely outcomes. If the 95-percent confidence interval is between two and eight seconds faster, that’s promising. If it’s between 25 seconds slower and 30 seconds faster, you’d assume there’s no real effect unless further evidence emerges.
The dangers of so-called are well-known and often unintentional. , when sports scientists were presented with sample data and asked what their next steps would be, they were far more likely to say they’d recruit more participants if the current data was just outside of statistical significance (p = 0.06) than just inside it (p = 0.04). These sorts of decisions, where you stop collecting data as soon as your results appear to be significant, in predictable ways: you end up with a suspicious number of studies with p just under 0.05.
Using confidence intervals is supposed to help alleviate this problem by switching from the yes/no mindset of p-values to a more probabilistic perspective. But does it really change anything? That’s the question Borg and his colleagues set out to answer. They used a text-mining algorithm to pull out 1,599 study abstracts that used a certain type of confidence interval to report their results.
They focused on studies whose results are expressed as ratios. For example, if you’re testing whether Hutcho Pills reduce your risk of stress fractures, an of 1 would indicate that runners who took the pills were equally likely to get injured compared to runners who didn’t take the pills. An odds ratio of 2 would indicate that they were twice as likely to get injured; a ratio of 0.5 would indicate that they were half as likely to get injured. So you might see results like “an odds ratio of 1.3 with a 95-percent confidence interval between 0.9 to 1.7.” That confidence interval gives you a probabilistic sense of how likely it is that the pills have a real effect.
But if you want a more black-and-white answer, you can also ask whether the confidence interval includes 1 (which it does in the previous example). If the confidence interval includes 1, which corresponds to “no effect,” that’s loosely equivalent to saying that the p-value is above 0.05. So you might suspect that the same values that lead to p-hacking would also lead to a suspicious number of confidence intervals that just barely exclude 1. That’s precisely what Borg went looking for: upper confidence interval limits between 0.9 and 1, and lower limits between 1 and 1.2.
Sure enough, that’s what they found. In unbiased data, they calculate that you’d expect about 15 percent of lower limits to lie between 1 and 1.2; instead they found 25 percent. Similarly, they found four times as many upper limits between 0.9 and 1 as you’d expect.
One way to illustrate these results is to plot something called the , which is a statistical measure of the strength of an effect. In theory, if you plot the z-values of thousands of studies, you’d expect to see a perfect bell curve. Most of the results would be clustered around zero, and progressively fewer would have either very strongly positive or very strongly negative effects. Any z-value less than -1.96 or greater than +1.96 corresponds to a statistically significant result with p less than 0.05. A z-value between -1.96 and +1.96 indicates a null result with no statistically significant finding.
In practice, the bell curve won’t be perfect, but you’d still expect a fairly smooth curve. Instead, this is what you see if you plot the z-values from the 1,599 studies analyzed by Borg:
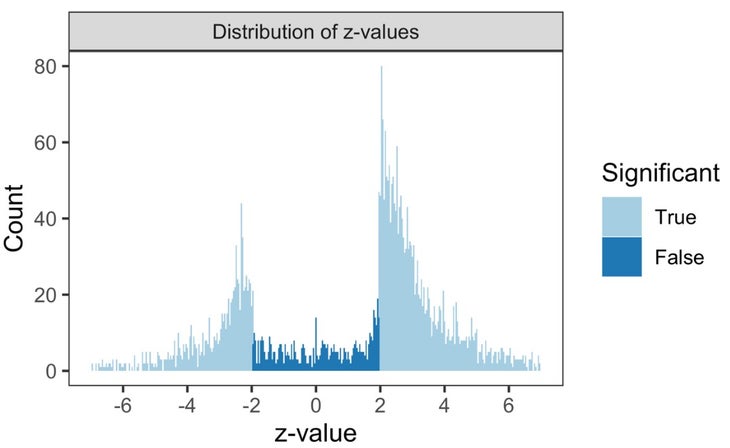
There’s a giant missing piece in the middle of the bell curve, where all the studies with non-significant results should be. There are probably lots of different reasons for this, both driven by decisions that researchers make and—just as importantly—decisions that journals make about what to publish and what to reject. It’s not an easy problem to solve, because no journal wants to publish (and no reader wants to read) thousands of studies that conclude, over and over, “We’re not yet sure whether this works.”
One approach that Borg and his co-authors advocate is the wider adoption of registered reports, in which scientists submit their study plan to a journal before running the experiment. The plan, including how results will be analyzed, is peer-reviewed, and the journal then promises to publish the results as long as the researchers stick to their stated plan. , they note, registered reports produce statistically significant results 44 percent of the time, compared to 96 percent for regular studies.
This seems like a good plan, but it’s not an instant fix: the journal Science and Medicine in Football, for example, introduced registered reports three years ago but has yet to receive a single submission. In the meantime, it’s up to us—journalists, coaches, athletes, interested readers—to apply our own filters a little more diligently when presented with exciting new studies that promise easy gains. It’s a challenge I’ve wrestled with and frequently come up short on. But I’m keeping this rule of thumb in mind from now on: one study, on its own, means nothing.
For more Sweat Science, join me on and , sign up for the , and check out my book .