


Sure, with a total distance of 2,081 miles in 23 days, including 26 major mountain climbs and a longest stage of 144 miles, looked fairly grueling. But did you realize that for roughly 25 percent of the race time, the cyclists weren’t even pedaling? In a month-long Tour, that’s like a week of paid vacation. That’s just one of the details that emerges from a detailed analysis of four years of race data from a professional cycling team, . And there’s plenty more.
The study was led by , a sports scientist at Stirling University in Scotland, and , the head of scientific research for the Germany-based , and delves into race data for 20 men and 10 women, all top-level professional cyclists with “a current World Tour professional cycling team.” While the article doesn’t identify this team, I think we can safely assume that it was Team Sunweb, whose top rider, Tom Dumoulin, finished second in this year’s Tour de France, and which also has one of the top women’s squads in the world.
Pro cyclists, needless to say, spend a lot of time cycling, typically covering about 15,000 to 22,000 miles a year for men, and 8,000 to 11,000 miles for women, according to the researchers. A lot of that time is spent racing: up to 100 days a year for men and 65 days a year for women. For most of those racing days, the team’s science crew collected three complementary pieces of data: heart rate, which gives a sense of physiological strain; power output, which gives an impartial reading how hard the rider is pedaling; and perceived exertion, which gives a subjective take on how hard the race was.
In total, over a four-year period, the team collected data on 3,640 days of racing by the 30 riders in the study. The aggregated results give some sense of what’s required to race a bike at the top professional level, which is certainly interesting. But the real goal of the study was to compare the men’s and women’s data, to get a sense of whether the demands of the men’s and women’s tours are sufficiently different that the riders should train differently.
Some basic background info: the average distance of a race day for the men was 114 miles, which took four hours and 45 minutes; for women it was 72 miles, which took three hours and 14 minutes. This combines multi-day stage races and one-day races into one big data set. The men sustained a slightly higher average power, at 3.0 watts per kilogram versus 2.8 for the women. The amount of time spent in different 0.75-watt power zones was roughly similar in men and women—with the largest amount of time, as I noted at the top, spent between 0 and 0.75 watts, corresponding to no pedaling.
But the most surprising difference was in heart rate. The women sustained an average heart rate of 152, which corresponded to 79 percent of their maximum heart rate. The men, on the other hand, sustained an average of just 133, which was 69 percent of their max. (For the record, the average max for women was 185, compared to 180 for men. But the calculations of average heart rate percentages aren’t simple, because not all riders raced the same amount.)
If you divide heart rate into five zones (above 50, 60, 70, 80, and 90 percent of max), here’s what the respective distributions look like:
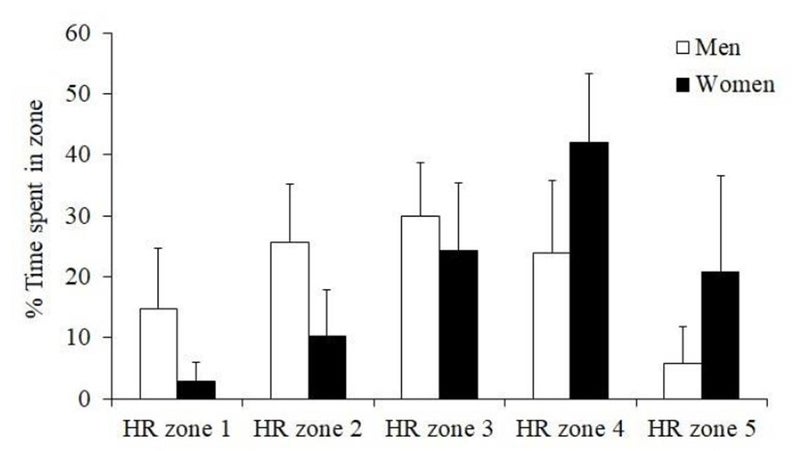
It’s clear that women are spending substantially more time in zones four and five, the highest intensity zones. On the surface, this is very easy to understand. Their races are only 63 percent as far, so they’re able to ride at a higher intensity for this shorter amount of time. Interestingly, when you look at perceived exertion, which is assessed on a subjective scale that runs from 6 to 20, both men and women had an average rating of 15.4. This suggests that the intensity of women’s races is higher by exactly the amount needed to balance the shorter distance—which makes sense if you believe that we ultimately judge our limits based on perceived effort.
One of the shortcomings of the study, the authors acknowledge, is that their heart rate zones are based on arbitrary percentages of maximum heart rate. You’d get more meaningful training zones by dividing your training based on time spent above or below actual physiological cutpoints like the lactate or ventilatory thresholds. Is it possible that women, on average, have thresholds at different heart rate percentages? In , I wasn’t able to figure out if there’s a consensus on this, particularly among well-trained athletes. Or to put it another way, if you ask men and women to exercise at, say, 85 percent of maximum heart rate and then rate their perceived exertion, will both groups give roughly the same answer?
Having a great dataset like this is the first step to answering some of these questions about potential differences between men and women. If you’re a female cyclist, don’t be surprised if your heart rate during races is higher than what male cyclists report. It’s possible, the researchers suggest, that women should train differently than men, incorporating more high intensity interval training to prepare for racing at higher intensities. It’s also possible (and this is me just spitballing here) that women’s races should be the same length as men’s races. But that’s a whole different discussion.
My new book, , with a foreword by Malcolm Gladwell, is now available. For more, join me on and , and sign up for the Sweat Science .