


Pretty much everything we know about how to run comes with an asterisk: “on average.” From the angle of your big toe to the contents of your mind, we have plenty of general insights about what good running form involves. But, as anyone who ever marathon world record-holder Paula Radcliffe run knows, some people thrive by breaking all the rules. What you really need, then, is a way of assessing how well a given piece of advice applies to your unique physiology.
That’s the goal of a in the European Journal of Sport Science, from a research team lead by Cornelis de Ruiter of Vrije Universiteit Amsterdam, on individualizing running cadence. Since cadence—the number of steps you take per minute—is relatively easy to measure and change (at least temporarily), it gets a lot of attention from runners and researchers alike. For a while, the idea that everyone should strive to take 180 steps per minute was popular. That idea has receded, but it left behind a bit of a vacuum. If 180 isn’t the goal, then what is? If the ideal cadence varies from individual to individual, then how do you find yours?
One possible answer is that you simply shouldn’t worry about it. Decades of studies have suggested that, left to their own devices, runners tend to self-select a cadence that optimizes their efficiency. That means that if you tell a runner to either speed up or slow down their cadence, chances are they’ll start burning more energy to cover the same distance at the same speed—on average, at least. In most of these studies, though, there are a few outliers whose self-chosen cadence is significantly off from their efficiency sweet spot. So the best general advice (don’t mess with your cadence) might be bad advice for a few people.
The other possible answer is that you should test different cadences and directly measure their efficiency. Traditionally, these studies have taken place in laboratories, using cumbersome breathing masks on treadmills to accurately measure energy consumption. In the new study, de Ruiter and his colleagues tried a simple outdoor test instead, using a standard heart-rate monitor to estimate energy expenditure while volunteers ran freely at different cadences. This approach is more realistic, since it’s not clear whether there are aspects of treadmill running—the lack of scenery moving past you, for example—that could affect cadence. And more importantly, it’s fairly straightforward to replicate if you want to try it yourself.
The basic test involves a 27-minute run at a self-selected comfortable pace, divided into nine three-minute blocks. The entire run is done at the same pace; in the study, the runners were paced by a cyclist using a bike speedometer. Each three-minute block is done at a different cadence, dictated by a metronome (there are lots of metronome apps available for phones). The cadences used in the study were 140, 150, 160, 170, 180, 190, and 200, plus one block at the cadence naturally selected by the runner for that pace. For each runner, these cadences were shuffled into random order. The ninth and final block repeated the cadence used in the first block, to enable correction for cardiovascular drift (more on that in a minute).
Here’s a typical example of what the data looks like if you plot heart rate (HR) versus cadence (SF, which stands for stride frequency, another term for cadence). The heart rates shown are the average of the final minute of each three-minute block, since it takes time for your heart rate to stabilize at a new level.
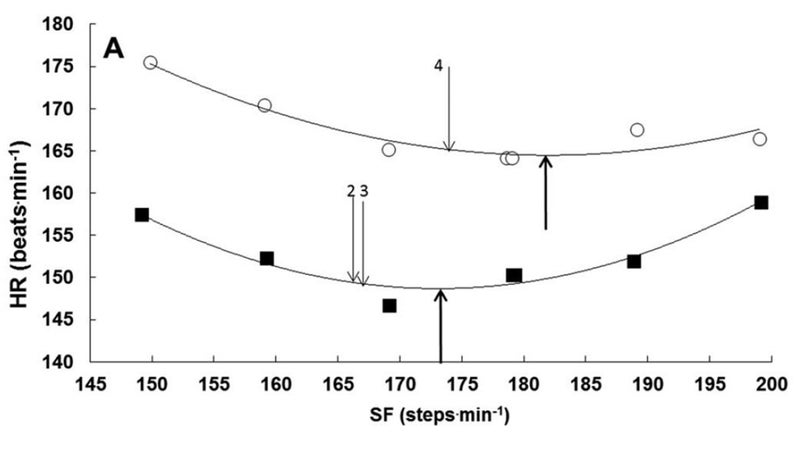
There are two tests shown here, one for a lower speed (black squares) and one for a higher speed (white circles). In each case, you can see a characteristic curve: at the lowest and highest cadences, heart rate is elevated. Somewhere in the middle, there’s a point where heart rate is lowest, which corresponds to the most efficient cadence.
The upward-pointing arrows indicate the cadence sweet spot for each curve, where this particular runner is most efficient at the two speeds tested. The downward-pointing arrows indicate the cadence this runner chose naturally at those speeds, when the metronome was turned off. (There are two downward-pointing arrows for the bottom curve, because this particular test was repeated twice.) In both cases, the freely chosen cadence is a bit lower than the optimal cadence, suggesting—in theory, at least—that this runner would benefit from a cadence increase of about 6-8 steps per minute.
A couple of key logistical points are worth highlighting. First, your preferred and optimal cadences are specific to a given speed. If you go out and perform this test at 8:00-mile pace and learn that your optimal cadence is 170, that does not mean that your cadence should be 170 when you’re racing at 6:00-mile pace. As in the example shown above, cadence generally increases with speed, so you should perform the test at whatever training or racing paces are relevant to you. This won’t be possible at faster-than-threshold speeds like your 5K race pace, because (a) your heart rate won’t stabilize, and (b) you won’t be able to maintain that pace for a 27-minute test anyway. Instead, stick to paces you could maintain for an hour or more.
A more subtle methodological point, as mentioned above, is . Even when you’re running at a relatively comfortable pace, your heart rate gradually rises over time as your body warms up. This could lead to bogus conclusions, since the cadences you test in the early sections will appear more efficient than the cadences tested near the end of the run.
Assuming you warm up for at least five minute before you start, your heart rate should drift up at a more or less constant rate. By running the first and last three-minute sections at the same cadence, you can apply a correction factor to eliminate the effects of the drift. Take the difference between the average heart rate in the first and ninth sections, and subtract one-eighth of that difference from the second-section heart rate, two-eighths from third-section heart rate, three-eighths from the fourth-section heart rate, and so on.
After doing all that, what should you expect? For the 21 experienced recreational runners in de Ruiter’s study, the average naturally preferred cadence was 165 steps per minute, while the most efficient cadence averaged 171 steps per minute. There was a fairly wide range, influenced mostly strongly by height: taller runners tended to take longer strides, and thus had lower cadences at a given speed.
While a difference of 6 steps per minute seems substantial, the actual benefits of fixing this “error” seems mostly trivial. If everyone ran at their optimal pace, the median heart rate would have decreased by just 0.5 beats per minute, which doesn’t seem worth the laborious effort of retraining your natural stride. There were, however, a few exceptions: at least two runners would be expected to see more meaningful decreases of 1 to 3 beats per minute. Of note, the subject with the most to gain happened to be one of the few runners in the study who didn’t report participating in organized races, in keeping with the idea that less experienced runners are less likely to have optimized their strides through trial and error.
It’s important to acknowledge that efficiency is not the only reason you might choose to alter your cadence. Some researchers that a higher cadence reduces loads on your knees and hips, reducing your risk of injury, though the evidence for this claim . From an efficiency perspective, most of us seem to dial in to an appropriate cadence without conscious effort. But if you suspect you’re one of the exceptions—or if you’re just curious—grab a heart-rate monitor and a friend with a bike and see for yourself.
My new book, , with a foreword by Malcolm Gladwell, is now available. For more, join me on and , and sign up for the Sweat Science .