


The fundamental question about training, from which all other debates and decisions emanate, is this: How hard was that workout you just finished? There are many ways of answering that question, using heart-rate monitors, power meters, GPS watches, oxygen-measuring facemasks, and gut feelings. One way or another, you have to have a sense of how hard you’re working, so that you can make decisions about how to distribute your training efforts each week, how to gradually increase your training load from month to month, and how to recover before races.
So which metric, if any, is best?
That’s the question tackled in in the International Journal of Sports Physiology and Performance, drawing on a database of four years of meticulous training and racing data from 21 professional cyclists with Germany-based Team Sunweb. The cyclists in the study won 45 World Tour races during the four-year period, including 29 Grand Tour stages, and two of them finished in the top ten of a Grand Tour. This is a seriously elite cohort. The analysis was done by Teun van Erp, Team Sunweb’s chief scientist, along with Carl Foster of the University of Wisconsin–La Crosse and Jos de Koning of Vrije Universiteit Amsterdam. (I wrote about a related analysis comparing Team Sunweb’s men and women back in August.)
The overall dataset consisted of 11,655 training sessions, time trials, and road races, all with power output recorded by a power meter. Of those sessions, about 7,500 also had heart-rate data recorded, and 5,500 also included a subjective rating of perceived exertion (RPE) on a scale of 6 (no exertion) to 20 (maximal exertion). This allowed the researchers to calculate four different measures of training load for each session, and compare them to each other to see how consistent they were.
There are two basic kinds of training load: external and internal. External training load is a totally objective measure of how much work you did: run 10K at 7:00 per mile, lift 100 pounds ten times, or whatever. Internal training load represents how hard you, as an individual, had to work to complete the session. That might be represented by your average heart rate during the workout, or simply by your subjective assessment of the effort you put in and how tired you are. Both types of metric are important, but it’s the internal load—the actual level of physiological stress your body experiences during a training sessions—that determines how you’ll respond and whether you’ll get fitter or overtrained.
The study uses two measures of external load, both based on the power meter data. One is simply the total mechanical energy (in kilojoules) exerted by the rider, as calculated from the power output throughout the ride. If two people do a ride together, they’ll have roughly similar total energy consumption if you ignore minor differences in weight, aerodynamics, and other factors—even though the ride may be way easier for one rider compared to the other.
The other measure of external load takes fitness differences into account by normalizing the power output relative to your “,” which loosely corresponds to the power you can sustain for a one-hour race. This approach, developed by Andrew Coggan, gives you a number called the Training Stress Score (TSS) that quantifies how hard a given session is for you personally. This is still a measure of external load, because it doesn’t care whether you’re fatigued or didn’t get a good night’s sleep or whatever, but it’s personalized to your abilities.
For internal load, one of the measures is based on heart-rate data. You get a score called LuTRIMP (short for ) based on the number of minutes you spend in each of three heart-rate zones, with the higher zones counting for more points than the lower zones. For example, every minute spent in the highest zone is equivalent to three minutes spent in the lowest zone, reflecting the fact that your body is working much harder when your heart rate is high. Unlike the external load measures, your LuTRIMP values will show that your body is working harder at a given pace when you’re, say, under the weather.
The other internal load measure is even simpler. Shortly after the workout is over, you answer the question “How hard was your day?” on a scale from 6 to 20, then multiply that number by the duration of the session in minutes. This is called the session RPE, or sRPE, and it’s free and never runs out of batteries.
The main figure in the paper looks very complicated but is actually really simple. You take all the available training sessions, pick two of the training load variables, and plot them against each other. How do subjective sRPE values compare to objective TSS values? If there’s good agreement, all the values on the graph should fall along a straight line, with the lowest sRPE values corresponding to the lowest TSS values, and the highest values proportionally higher. Then you do the same for all the other possible pairs of training metrics, and you plot the results separately for training sessions, road races, and time trials.
That’s a ton of data, but all of the 18 graphs look something like this:
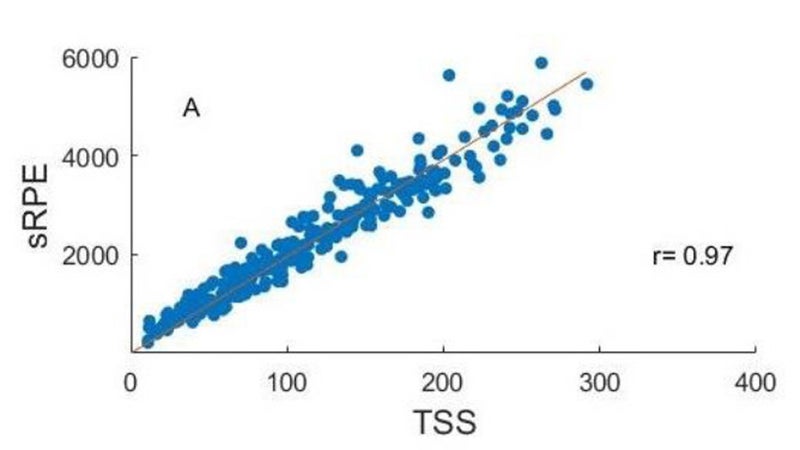
In this one, which shows representative data from one rider, sRPE is one the vertical axis and TSS is on the horizontal axis. You can see the data falls along a pretty good straight line—in fact, the correlation coefficient is 0.97, which is what statisticians would call “almost perfect.” Virtually all the pairs of metrics have correlations that are almost perfect or, at worst, very large. In other words, if you’re measuring RPE and doing it well, this suggests that you’re getting as much information about your training effort as you’d get with a power meter and a bunch of sophisticated analysis. As the researchers conclude in the paper: “any method of monitoring [training load], which is consistently applied and discussed between coach and athlete, may be more or less equivalent in net value.”
I’ll admit that I like that message—the idea that our internal computers are as sensitively tuned to the subtleties of effort as any external gadget can be. I think it’s important not to completely outsource your pacing decisions to technology, and to have a finely tuned sense of how hard you’re working (as distinct from how fast you’re going). But it’s also important not to flip too far to the other side and discount the importance of external data, for a few different reasons.
One methodological point is that this training and racing data ranges from easy half-hour spins to longer rides lasting five or more hours. Any reasonable training metric that incorporates the duration of the ride is going to have an easy time determining which of those two options is harder, so it’s not surprising that all the metrics have high correlations with each other. A tougher test would be to see how good a given metric is at distinguishing two rides with similar durations but slightly different speeds. I suspect sRPE would still be pretty good, but perhaps not “almost perfect.”
It’s also worth noting that correlations between metrics were tighter for workouts than they were for races. In race situations, you may have bad weather and imperfect hydration and fueling, because it’s harder to control the environment than it is in training. This changes your internal load relative to a given external load. The road racing data, much of it taken from Grand Tours, may also reflect accumulated fatigue from weeks of racing, which again will boost internal load relative to external load. This is not a bug in the system, the researchers point out—it’s actually a feature. In fact, if you had perfect correlation between internal and external metrics, that would mean you’d lost all the extra personalized value you’re supposed to get by measuring internal load.
In other words, it’s not about which metric is better. Instead, it’s the relationship between internal and external metrics that tells you whether you’re getting fitter or overly fatigued. In training, it’s meaningless to know that your internal load is going up or down if you don’t also know whether you’re going faster or slower. In racing, it’s useless or even counterproductive to know what power output you “should” be able to maintain if you don’t also consider how you’re feeling that day. So the message here isn’t that you should ditch your power meter. It’s that you should also trust how you feel—and track it. Those subjective numbers, which it may seem like you’re pulling arbitrarily out of a hat, are trying to tell you something meaningful.
My new book, , with a foreword by Malcolm Gladwell, is now available. For more, join me on and , and sign up for the Sweat Science .